The facade of our building is covered by dark stone and our lab is equipped by a huge south-east facing window. The air condition in the lab consists of a small wall-mounted AC unit and mechanical ventilation input and output (exhaust). The AC is connected to a heat exchanger placed on the roof of the building, which is common for many other AC units in various rooms. The AC system and the ventilation system are controlled independently. This results in large temperature drifts and gradients across the lab. Relative humidity and air pressure are completely out of control.
To get solid data for my future AC rants I have decided to build a simple temperature and relative humidity (RH) monitoring network for our lab. The system should be cheap, easily extensible and preferably without any hard or time consuming coding. Sensors employed should be digital ones with single-wire serial protocol—the connection between a main unit and the sensor would require only three wires and would be less affected by a noise. SHT15 from Sensirion matches well these requirements but requires serial clock too (2-wire protocol) and costs USD 30. I have chosen AM2303 sensor from Aosong (Guangzhou) Electronics Co, sold as DHT22 by Adafruit (USD 10). In the Czech Republic it is sold by KLelektronik.cz.
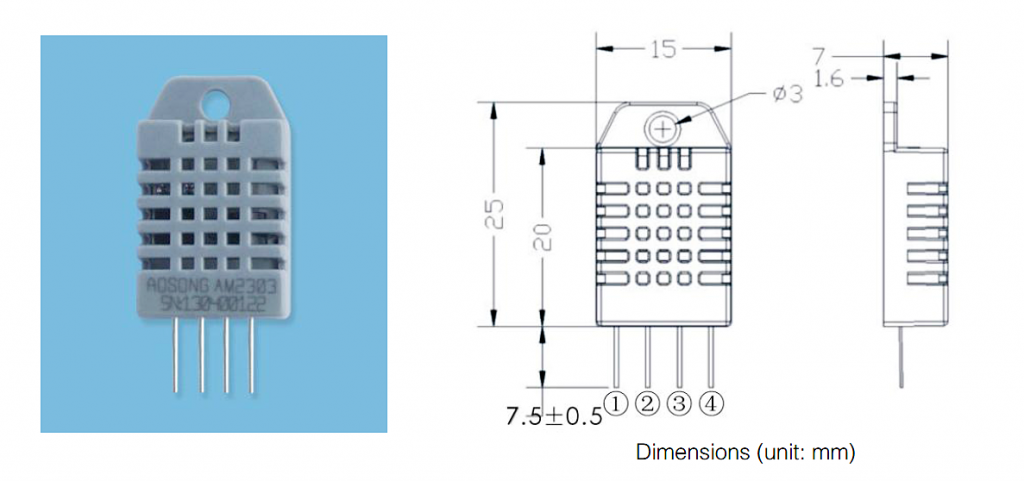
There are four pins, from left to right: VCC (5V power), SDD (serial data in/out), NC (not connected), and GND (ground). Pull-up resistor around 10k is suggested between VCC and SDD pins. Further, a by-pass capacitor can be added between VCC and GND.
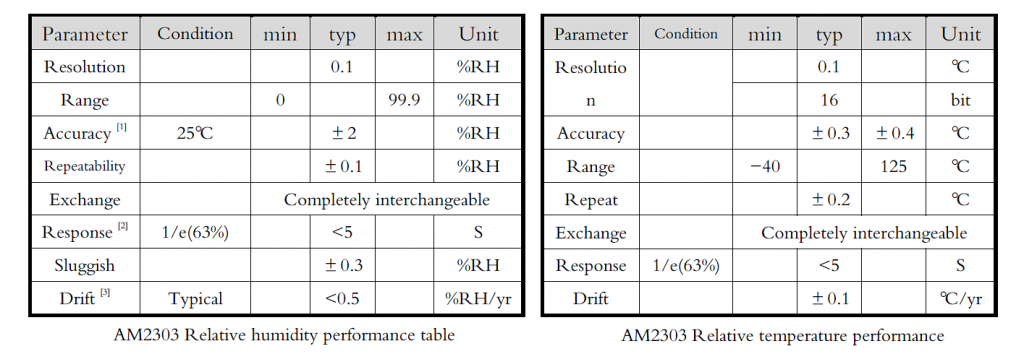
The AM2303 device consists of polymer capacitor humidity sensor, one-wire digital thermometer DS18B20 from Maxim Integrated Co and 8-bit micro-controller. It offers the temperature and RH resolution of 0.1 deg C and 0.1%, accuracy of +-0.3 deg C and +-2%, repeatability of +-0.2 deg C and +-0.1%, and drift of +-0.1 deg C/year and <0.5%/year, respectively. The sensors have to be put together at the beginning and calibrated, in our case to an average of their readings.
I employ Arduino Micro (USD 25) based on the ATmega32u4 to communicate with AM2303 sensors—a single digital Arduino pin is used for each sensor. Up to 20 one-wire sensors can be managed directly by this board. Arduino library for AM2303/DHT22 sensor can be downloaded from GitHub and it includes a simple example sketch, which can be easily extended to more sensors and serial RS232 communication with PC. The preliminary version of Arduino sketch follows.
#include "DHT.h"
#define MAX_ITER 10
#define DHTTYPE DHT22
DHT dht2(2, DHTTYPE);
int startbyte;
int i;
float auxTemp;
float auxHum;
float meanHum[3] = {0.0, 0.0, 0.0};
float meanTemp[3] = {0.0, 0.0, 0.0};
void setup()
{
  Serial.begin(9600);
  dht2.begin();
}
void loop()
{
  if (Serial.available() > 0)
  {
    startbyte = Serial.read();
    if (startbyte == 't')
    {
      meanHum[0] = 0.0;
      meanTemp[0] = 0.0;
      for (i=0;i<MAX_ITER;i++)
      {
        auxTemp = dht2.readTemperature();
        auxHum = dht2.readHumidity();
        meanTemp[0] += auxTemp/(float)MAX_ITER;
        meanHum[0] += auxHum/(float)MAX_ITER;
        delay(500);
      }
      Serial.print(meanTemp[0],4); Serial.print(",");
      Serial.print(meanHum[0],4); Serial.println("");
    }
  }
}
The data acquisition from the Arduino over RS232 interface and logging to a file on PC is easy to code using Python. Real-time streaming and plotting can be done with help of Plot.ly project, which offers APIs for several programming languages including R, Matlab and Python. Plotly’s streaming functions enable us to update a plot in real-time, without refreshing a browser—we can continuously send data to Plotly’s server and visualize this data in real-time. Simple Python program for single-sensor output streaming/plotting follows.
#!/usr/bin/env python
import serial
import time
import plotly.plotly as py
from plotly.graph_objs import *

arduinoFile = '/dev/ttyACM1'
logFile = 'log.csv'
sensorOutput = [0.0, 0.0]

py.sign_in('my_username','my_api_key')
stream_ids=[my_stream_id_0, my_stream_id_1]

my_data = Data([
    Scatter(x=[], y=[],
         name='Sensor 1 temperature',
         mode='lines',
         line= Line(color='rgba(250,30,30,0.9)',width=2.5),
         stream=dict(token=stream_ids[0],maxpoints=900)),
    Scatter(x=[], y=[],
         name='Sensor 1 humidity',
         mode='lines',
         line= Line(color='rgba(30,30,250,0.3)',width=2.5),
         stream=dict(token=stream_ids[1],maxpoints=900), yaxis='y2')
    ])

my_layout = Layout(
    title='Temperature and RH in QOLO lab 4.061b',
    xaxis=XAxis(
         showline=True,
         linecolor='#bdbdbd',
         title='Time',
         showticklabels=True),
    yaxis=YAxis(
         showline=True,
         linecolor='#bdbdbd',
         title='Temperature [*C]',
         showticklabels=True,
         titlefont=Font(size=18,color='#ee3333')),
    yaxis2=YAxis(
         showline=True,
         linecolor='#bdbdbd',
         title='Relative humidity [%]',
         titlefont=Font(size=18,color='#3366dd'),
         side='right',
         overlaying='y'),
    legend=Legend(x=0,y=1), showlegend=True
    )

my_fig = Figure(data=my_data, layout=my_layout)
py.plot(my_fig, filename='Temperature_in_QOLO_lab_4.061b')
time.sleep(3)

s1temp = py.Stream(stream_ids[0])
s1hum = py.Stream(stream_ids[1])

ser = serial.Serial(arduinoFile, baudrate=9600, bytesize=8,
    parity=serial.PARITY_NONE, stopbits=serial.STOPBITS_ONE, timeout=10)
time.sleep(1)
ser.flushInput()

def gettemp():
    ser.write('t')
    ser.flush()
    return ser.readline().strip('\r').strip('\n')

timeStart = time.time()
while True:
    timeDelay = time.time()-timeStart
    timeStamp = time.strftime("%Y-%m-%d %H:%M:%S")
    sensorOutputString = gettemp()
    sensorOutputRaw = sensorOutputString.split(',')
    sensorOutput[0] = float(sensorOutputRaw[0]) + 0.4  # calibration
    sensorOutput[1] = float(sensorOutputRaw[1]) + 0.2
    resultString = str(timeDelay)+','+timeStamp+','+
        str(sensorOutput[0])+','+str(sensorOutput[1])
    print(resultString)
    my_file = open(logFile,'a')
    my_file.write(resultString+'\n')
    my_file.close()
    s1temp.open()
    s1hum.open()
    s1temp.write(dict(x=timeStamp,y=sensorOutput[0]))
    s1hum.write(dict(x=timeStamp,y=sensorOutput[1]))
    s1temp.close()
    s1hum.close()
    time.sleep(50)

ser.close()
And finally, here is the typical plot of the temperature and RH in our lab:
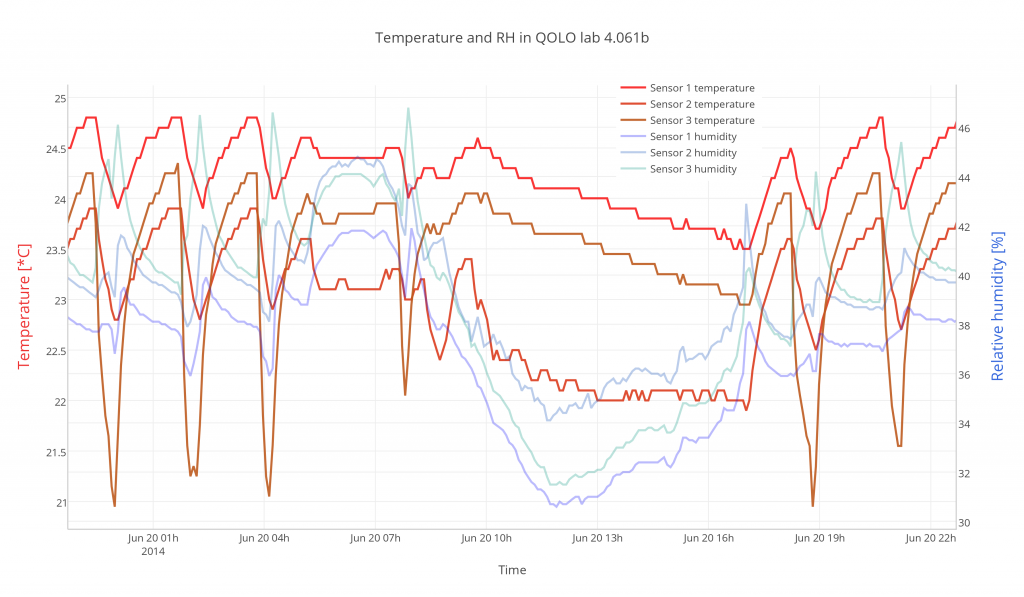
taken on Jun 20th, outside temperature (9:30-16:00): 16-17 deg, 25 km/h, RH 55-60%; night: 13-15 deg, 10-15 km/h, RH 70-85%; max pressure: 1011.2 hPa. The temperature outside was lower than the AC setpoint (24 deg). There are three AM2303 sensors placed at different places of the lab. They yield three temperature traces and three RH traces. The sensor #2 is partially influenced by air flowing from the ventilation and the sensor #3 is affected by colder air from the AC unit. The sensors are connected by 10-20 m long unscreened ribbon cable from Harting (3 wires separated from 14-way cable, RS Stock No. 719-3455) to the Arduino Micro board, which is connected to qolo1rack computer. Later, it will be replaced by an old wifi-equipped notebook or Raspberry Pi with wifi dongle.
The real-time version of the log you can find here: http://plot.ly/~MiroslavJezek/2
We have recently acquired more sophisticated sensor from Comet System: web sensor T6540. It measures temperature, RH and CO2 concentration and is equipped with LCD display, Ethernet interface and WWW server. Including temperature calibration it costs USD 400 (almost USD 500 inc. VAT). It would be interesting to compare this sensor with the system based on AM2303/DHT22+Arduino+Plotly.
Web sensor #1: QOLO lab 4.061b, sensor #2: student lab 4.008b, sensor #3 & #4: office of phd students.
